
How to Publish High-Quality Simulink Figures for Research Papers
If you’re working on a thesis, research paper, or technical documentation, you’ve likely struggled with making your Simulink plots publication-ready. I’ve been there—figures that looked fine on-screen turned blurry or misaligned when exported. In this tutorial, I’ll walk you through the exact process I follow to edit and export Simulink figures from .fig format into clean, high-resolution images suitable for professional publishing. Whether you’re a student or a researcher, this guide will save you hours of formatting and help your figures look polished and precise.
Why Use .fig Format?
Simulink allows you to save figures in MATLAB’s native .fig format, which stores all properties of the plot—axis labels, legends, line widths, colors, font sizes. This makes it much easier to update your figure without rerunning the entire simulation.
Step-by-Step Plot Editing Workflow
Step 1: Save Your Simulink Plot as .fig
After running your Simulink model, go to the plot window and - Save the Figure in .fig format
This preserves the full object structure and makes the figure editable later.
Step 2: Open and Edit the .fig File
Open the .fig file using MATLAB. Navigate to:
Tools → Edit Plot
Now double-click on any plot element (axis, line, label). A property editor window will pop up.
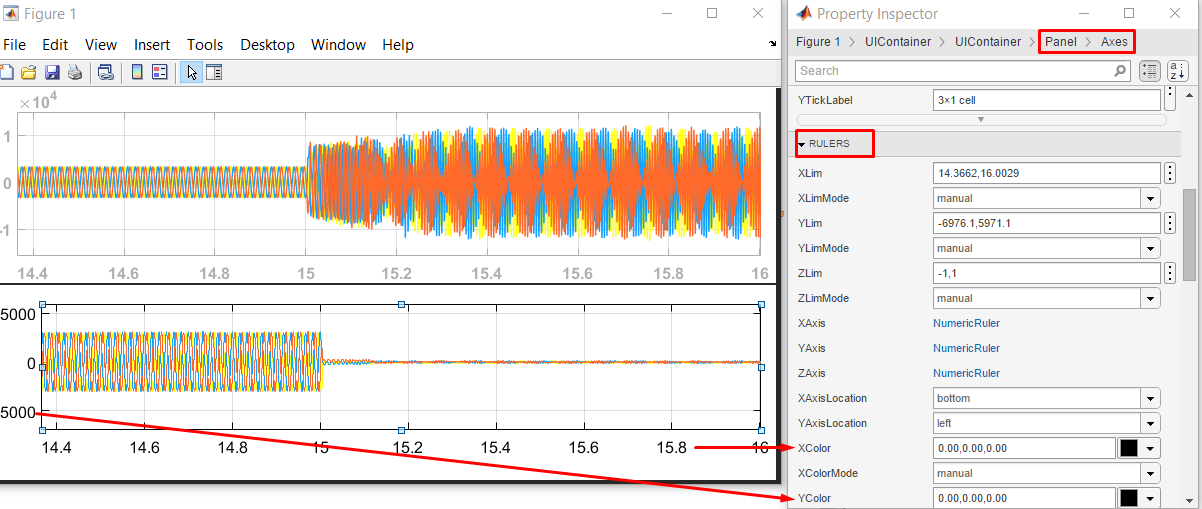
Step 3: Update Axis Colors and Properties
You can now:
- Change X and Y axis label color and font
- Adjust axis limits
- Add gridlines
- Customize tick marks
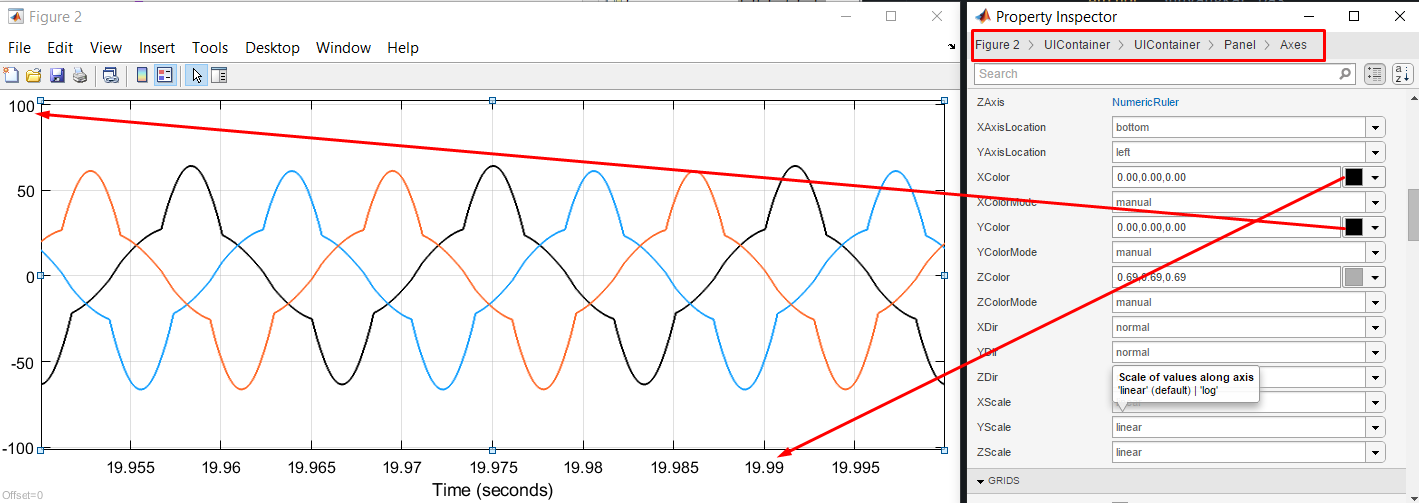 Change fig axis color
Step 4: Change Line Width and Color
To enhance visibility, double-click on any line or signal and update its line width and color from the pop-up.
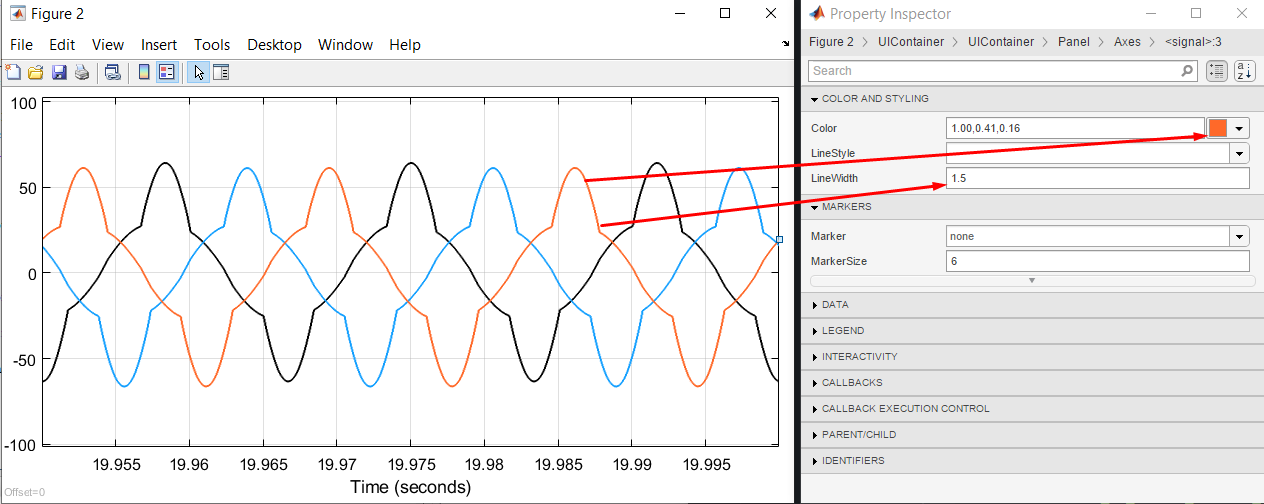 Changing line thickness for clarity:
 Example of axis property editor:
Exporting the Figure for Publication
Once your figure is finalized, use the following script to export it in high resolution (300 DPI) and a specific image size.
clear all; close all; clc;

fidName = 'Xfmr_LV_PhaseC_Current_Harmonics';
imageName = "2.3_Xfmr_LV_PhaseC_Current_Harmonics.png";

% Open the .fig file
fname = strcat(fidName,'.fig');
p1 = openfig(fname);

% Update Line Width
hline = findobj(gcf, 'type', 'line');
set(hline,'LineWidth',1.2)

% Set axis font size and grid
grid on;
set(gca,"FontSize",11);

% Set image size and resolution
imageWidth = 4.5;
imageHeight = 3;
imageDPI = '-r300';
imageFormat = '-dpng';

set(gcf,"Units","inches");
set(gcf,"position",[0,0,imageWidth,imageHeight])
print(imageName,imageFormat, imageDPI);
Final Tips for High-Quality Figures
- Use consistent font sizes and line widths across all your figures.
- Always preview the final PNG or PDF before inserting into your paper.
- Stick to grayscale or color-blind-friendly palettes if publishing in print journals.
- Maintain 300 DPI or higher for professional publication.
🛠️ Quick Recap
- ✅ Save your Simulink figure as
.fig - ✅ Use
Edit Plotto customize elements - ✅ Adjust line widths and font sizes manually
- ✅ Export using a script with proper DPI and image size
👋 About Me
Hi, I’m Shuvangkar Das, a power systems researcher with a Ph.D. in Electrical Engineering from Clarkson University. I work at the intersection of power electronics, DER, IBR, and AI — building greener, smarter, and more stable grids. Currently, I’m a Research Engineer at EPRI (though everything I share here reflects my personal experience, not my employer’s views).
Over the years, I’ve worked on real-world projects involving large scale EMT simulation and firmware development for grid-forming and grid following inverter and reinforcement learning (RL). I also publish technical content and share hands-on insights with the goal of making complex ideas accessible to engineers and researchers.
📺 Subscribe to my YouTube channel, where I share tutorials, code walk-throughs, and research productivity tips.
Connect with me:
📚References
[[Simulink Fig File Print Methods]]
Leave a comment